
 welcome
 news
news gate-level
 rtlib
rtlib cosimulation
 browser
 waveforms
 scripting
 documentation
 download
 webstart
 gallery
 links
links about
aboutApplets
 contents
 visual index
 usage
usage FAQ
FAQ feedback
 license
Styx: the Hades waveform viewer
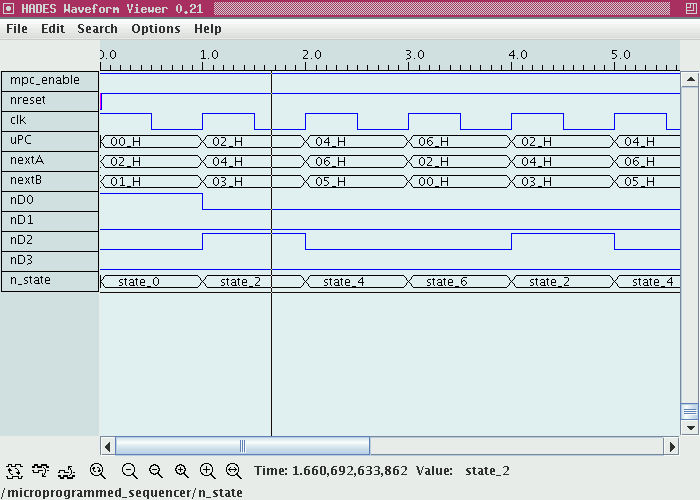
Waveform traces are the most common means to visualize and analyze the behaviour of digital systems. However, the role of waveforms is much smaller in Hades than in traditional simulation environments, because the interactive simulation mode allows you to watch your circuits in real-time. Still, the Hades framework includes its own light-weight waveform viewer. While less powerful than fully featured waveform viewers (for example, GtkWave), it should be ok for most simple tasks. Following the Greek mythology pattern, our waveform-viewer was named Styx (after the river that forms the entry into Hades and divides the world of the living and the dead).

Usage
To trace a signal, simply select the corresponding menu item from the signals menu in the editor, or move the cursor to a vertex of the target signal and type the p ('probe') bindkey. The selected signal will be added (at the bottom) to the signals list of the waveform viewer. The editor automatically creates the waveform viewer window and data structures when you add the first probe to your current design. Once created, the waveform viewer window remains active, but you can show or hide the waveform viewer at any time.The Hades editor includes a few handy commands in its signals menu, e.g. adding probes to all input and output signals of the current circuit. Note that the signal probes are not saved with your design; all probes are automatically deleted when you open a new design or re-open the current design in the Hades editor. If you regularly need a lot of signal traces, you might want to write a short Jython script to automate this.
To save CPU time, the waveform viewer will not automatically repaint the waveforms during a simulation. Just select the update waves command, press one of the different zoom buttons, or move the horizontal (time-) or vertical (signallist-) scrollbar to request an update of the waveforms. For example, press the zoom-fit button repeatedly to repaint the waveforms. Note that the Java virtual machine uses a single thread for all user-interface painting operations: the editor window will not be updated while Java is busy repainting the waveforms, and vice versa. If necessary, pause the simulation before pressing one of the zoom-buttons.
Move the crosshair cursor around and watch the corresponding time in the status panel at the bottom of the waveform viewer window. The status panel will also show the corresponding signal value when you click the mouse-button somewhere in the waveform-trace window.
Use the zoom-buttons together with the time-axis scrollbar to select a time range from your waveform data. Use mouse-dragging to mark a region and the press the zoom-region button to zoom into the selected time range.
Note that you might have to zoom-in quite deeply, if you want to study gate-delays during interactive simulation. For example, the default gate-delays of a standard inverter and a standard AND gate are set to 5 nanoseconds and 10 nanoseconds, while typical user-events are 1 second apart. Therefore, a zoom-fit command will scale to the second-range, and you will have to zoom-in about a factor of 100.000.000 to see the activity in the nanosecond range.
In such situations, you might try the zoom auto function. Just position the cursor at the simulation time that you are interested in, and type the 'a' bindkey. The waveforms will be rescaled so that the nearest (preceding or next) event will be a few pixels apart from the selected time. You can now use the standard zoom and scroll functions to finetune the display. However, the 'zoom auto' functions is quite new and has not been tested extensively; please let us know whether it works (or not) for you.
Select the clear waves from the waveform-viewer menu to clear all current wave data (but keep the signal list).
Supported signal types
The waveform viewer currently supports the following signal types:- hades.signals.SignalStdLogic1164 (UX01ZWLHD)
- hades.signals.SignalStdLogicVector
- hades.signals.StringSignal
- hades.signals.SignalInteger
Known problems
While the waveform-viewer should work fine for most standard situations, there are a few known issues that you might want to keep in mind:- the waveform-viewer keeps all waveform data in memory.
As the simulation kernel will execute about a million events
per second on current workstations,
the Java virtual machine may run out of memory in a few seconds
when you trace signals with lots of events
(e.g. because you put a trace on your clock-signal).
Use the clear waves menu command to delete all current
wave data, which also reclaims the memory used for the waves data.
- you can not write partial waveform data to a file during a simulation.
- the labeling of the time-axis is suboptimal for certain zoom-factors.
- zoom-operations (including zoom-fit) sometimes fail due to arithmetic underflow/overflow.
- xor-mode repainting sometimes leaves the old cursor around.
- the search operations are only partially implemented. See the Hades tutorial for a detailed explanation.
- no standard waveform file formats (like Verilog VCD) are supported for import or export.
- the PPM export basically is a screenshot of the current display.